HAIviz is an Interactive Healthcare-Associated Infection Visualization Tool for Integrating and Communicating Genomic Epidemiological Information of Local Outbreaks.
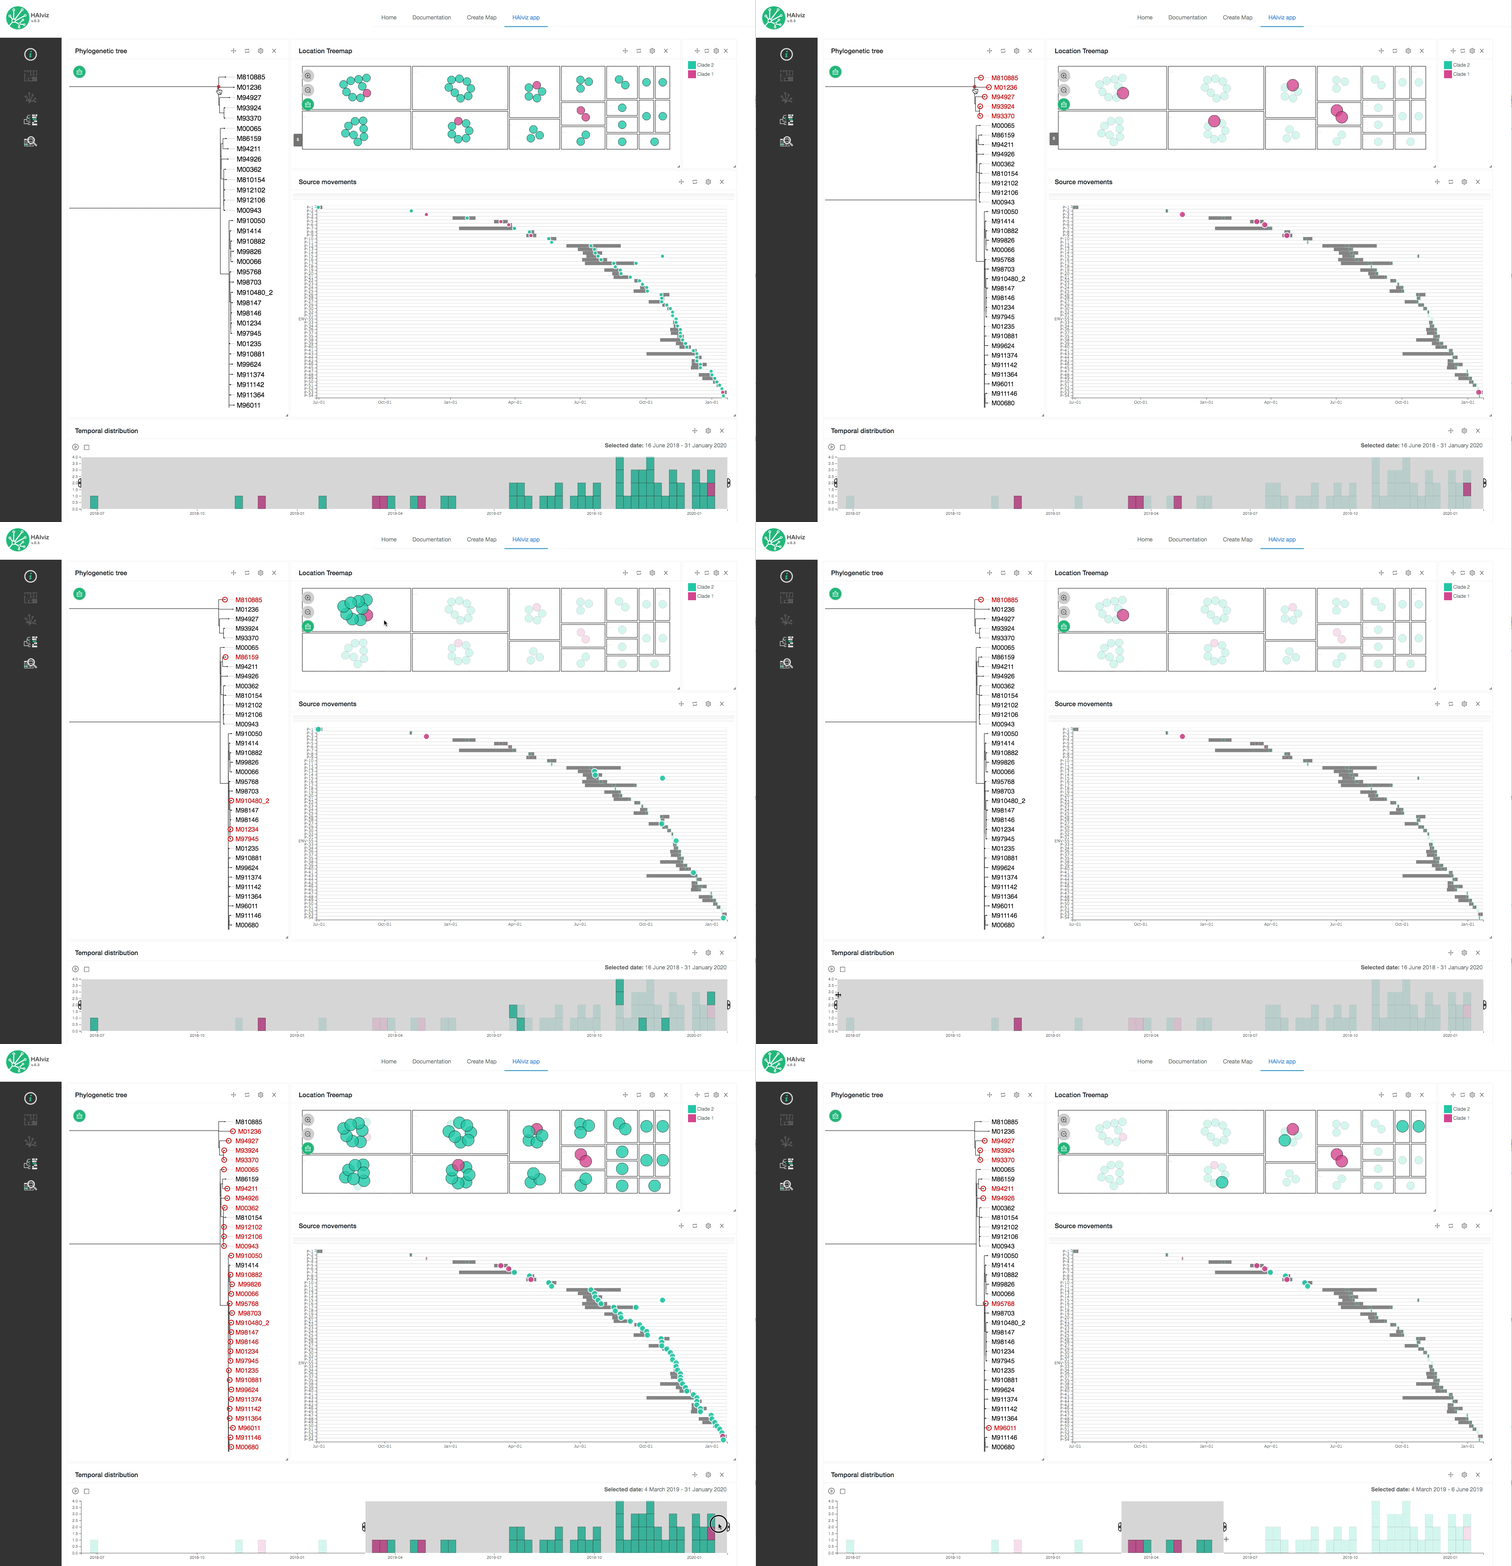
HAIviz displays and links the outbreak timeline, locations, isolate relationships, patient bed movement, and infection transmission route on a single interactive web dashboard.
You can create interactive visualization like this by just drag and drop in the browser.

Please cite the HAIviz paper if HAIviz is used to generate figures for publications:
Available soon.


